Dashboard
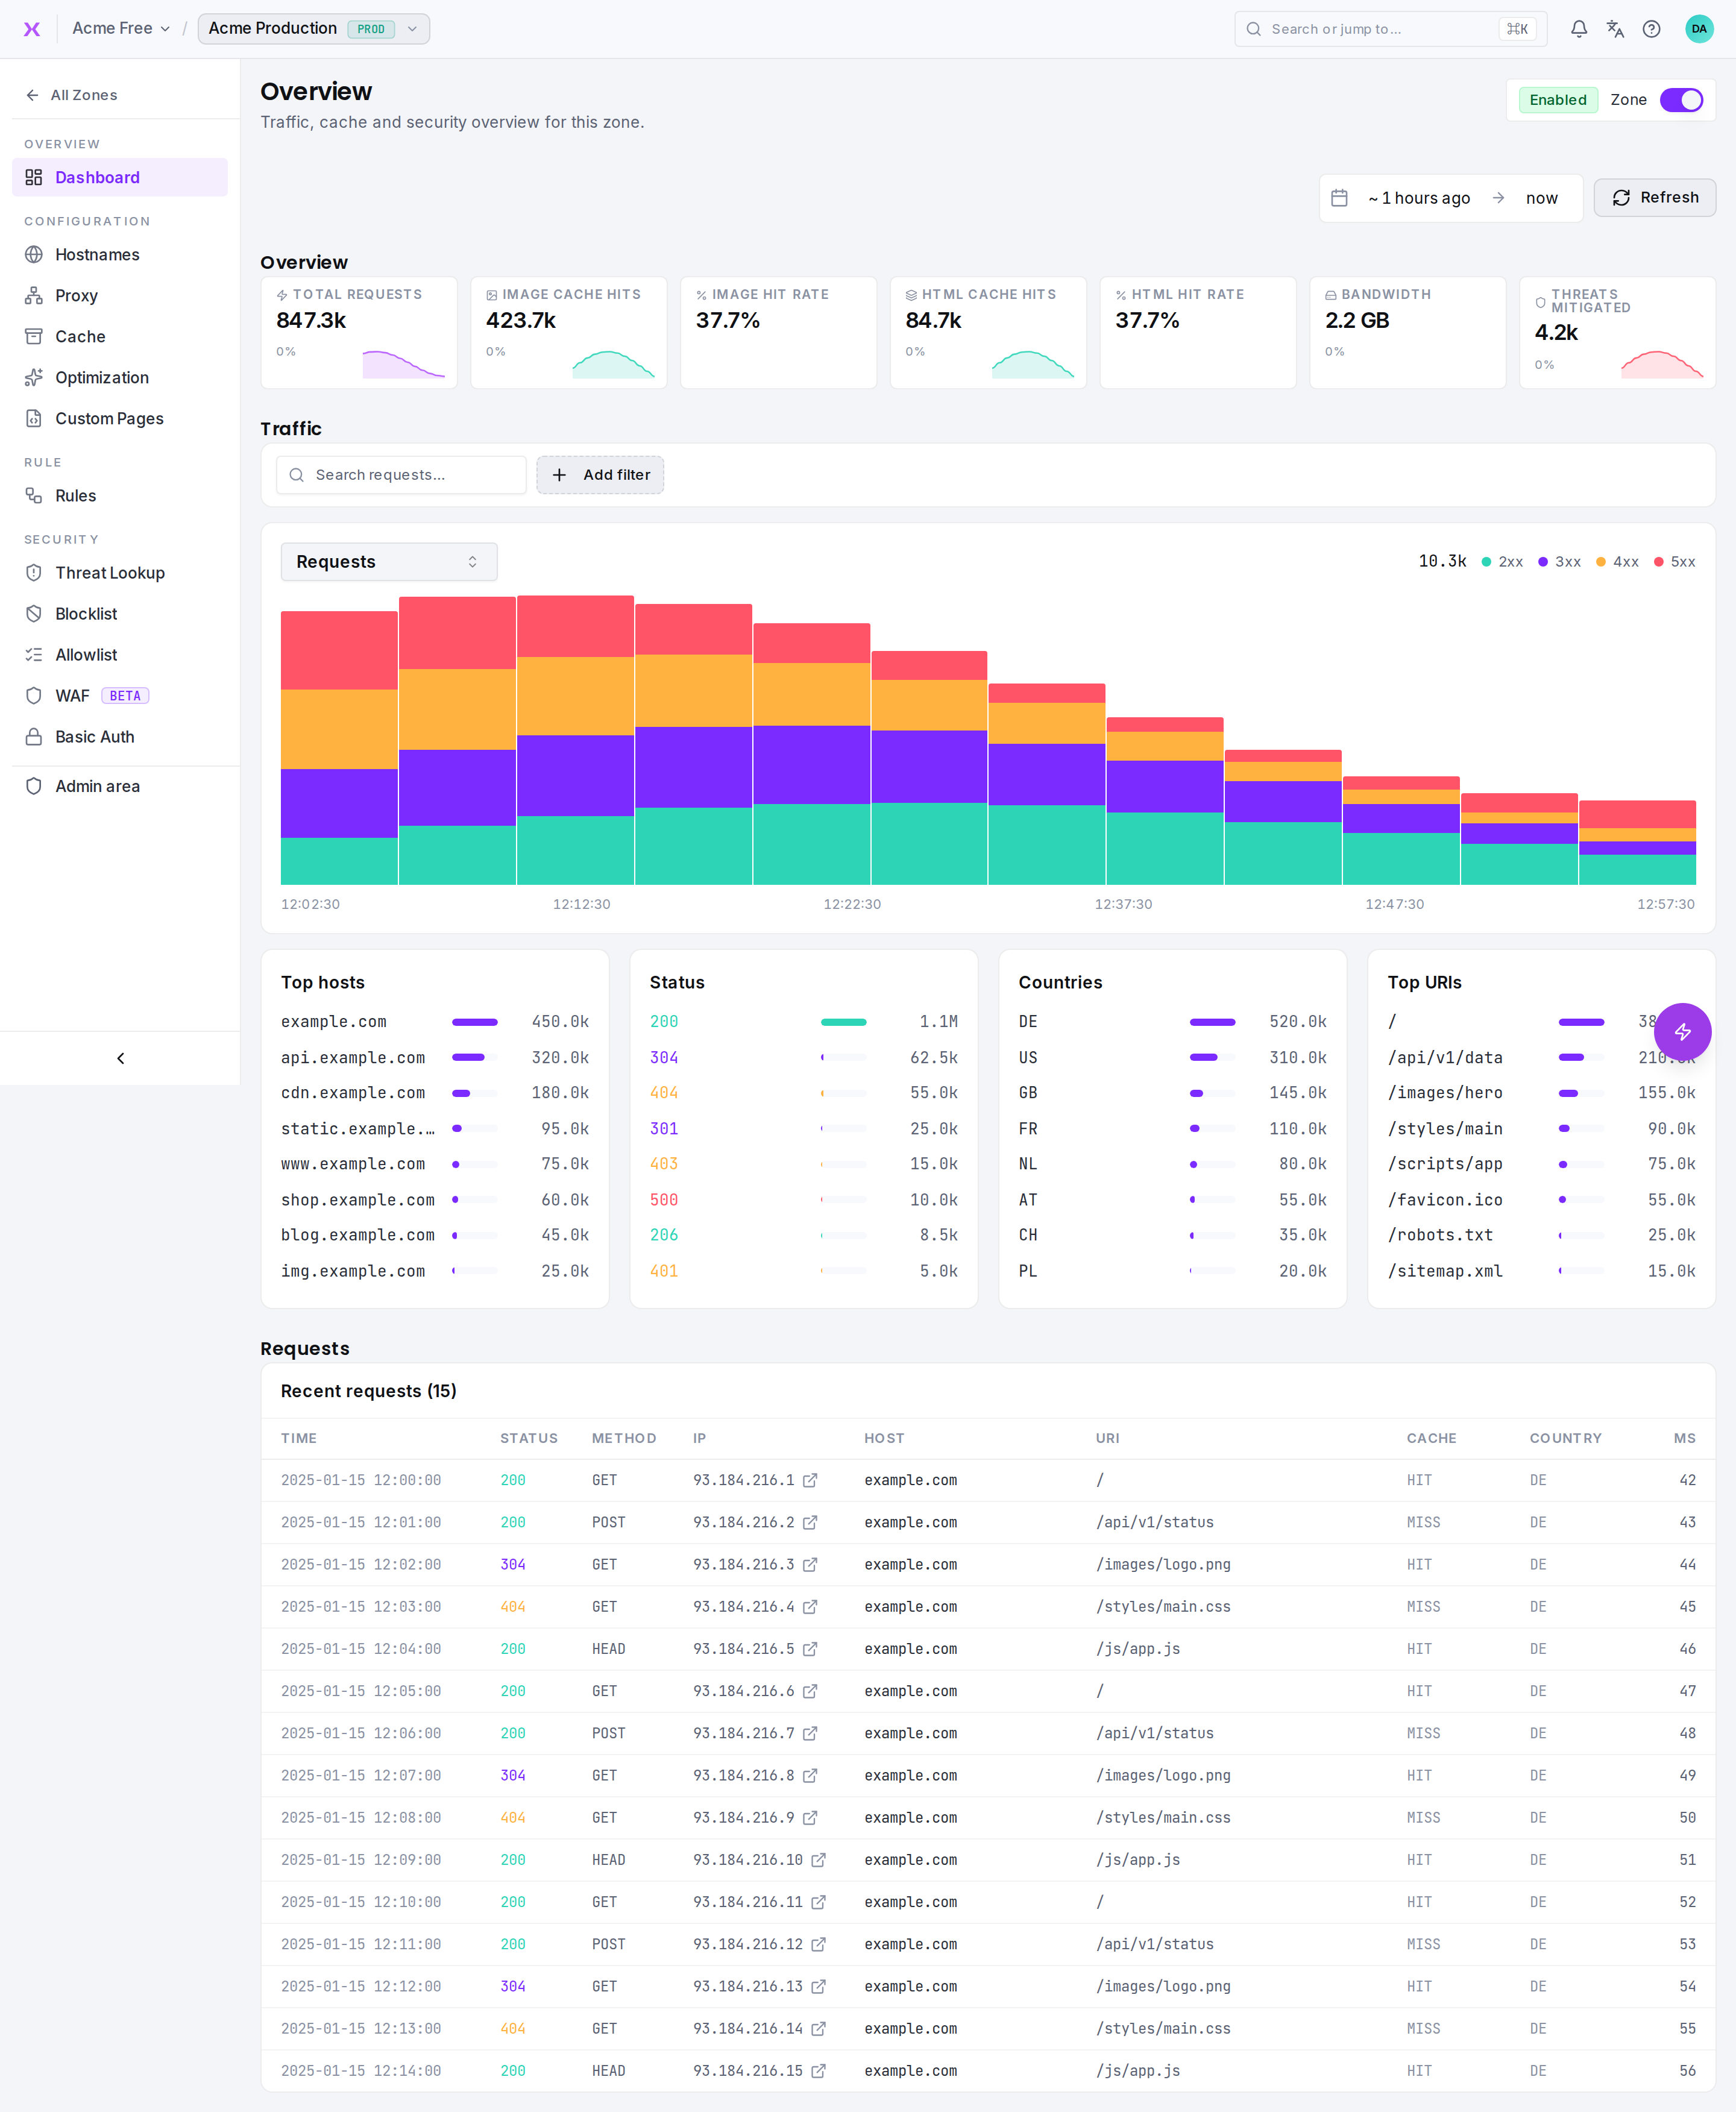
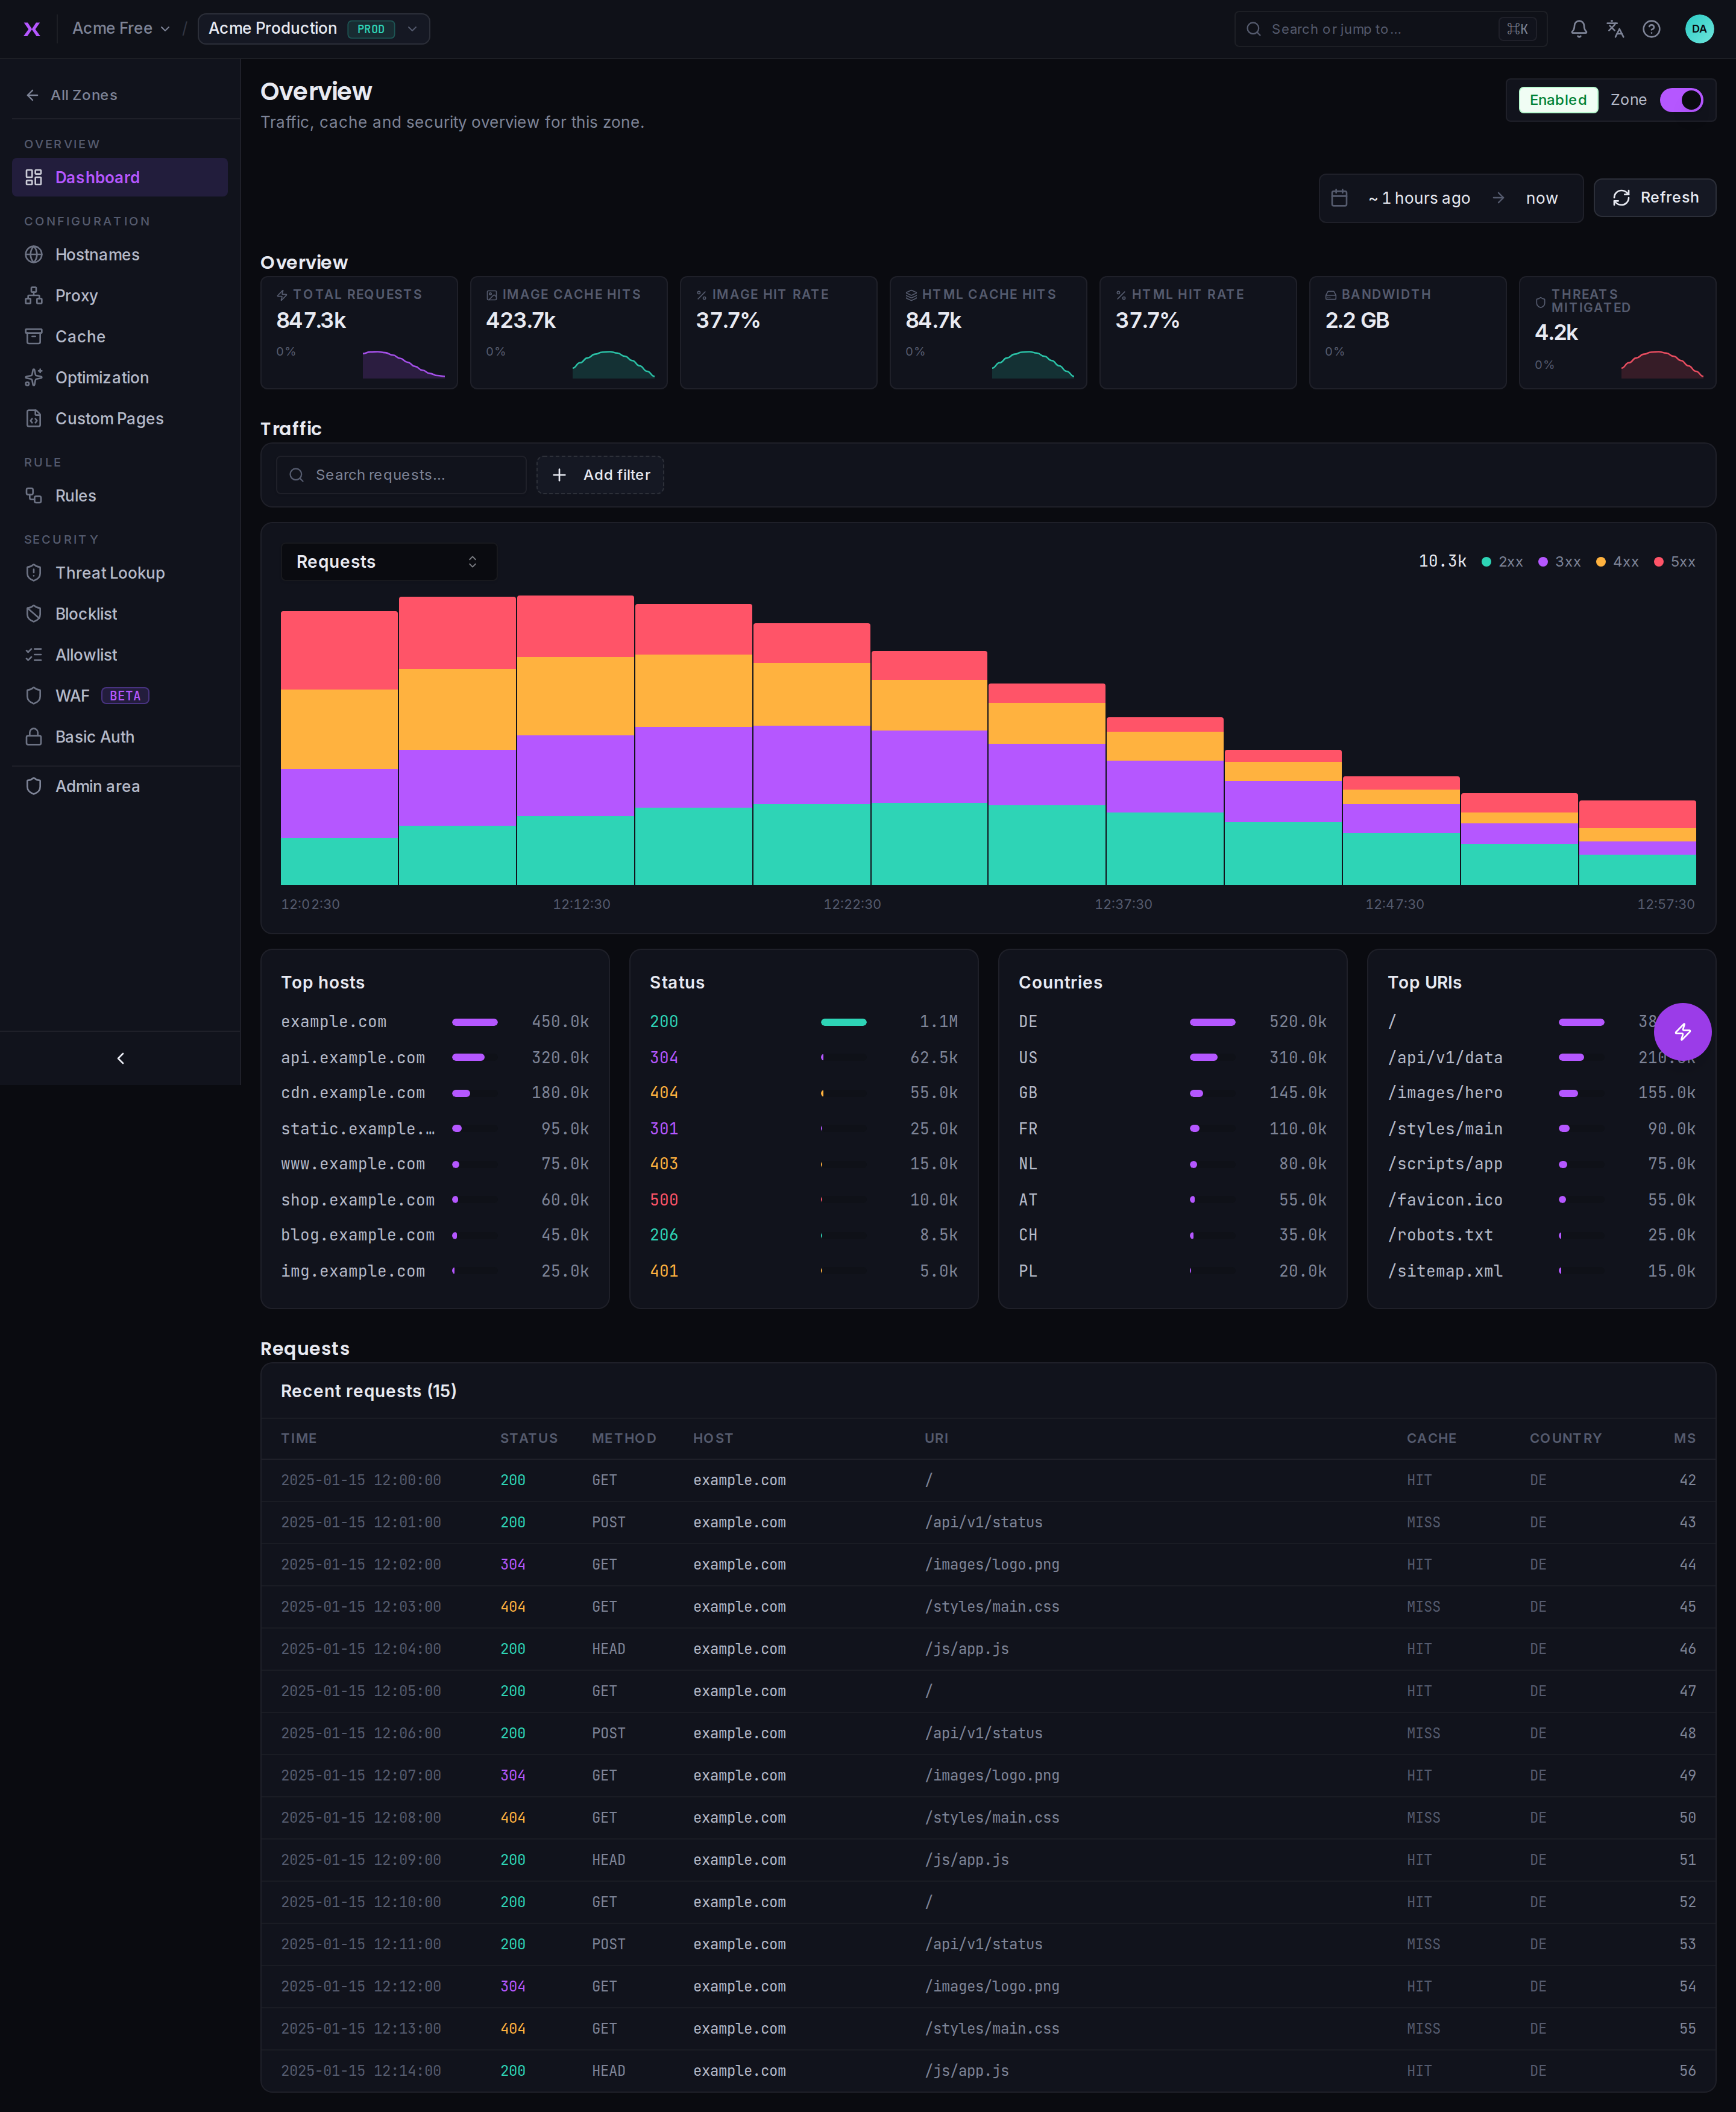
The Dashboard is the central overview for your zone. It shows traffic metrics, provides quick access to common actions, and -- while a zone still needs setup -- guides you through activating it. By default it shows the last hour; you refresh it yourself with the time-range picker.
Key Metrics
At the top of the dashboard, seven KPI cards summarize your zone's performance for the selected window:
| Metric | Description |
|---|---|
| Total Requests | Total requests served by smoxy |
| Image Cache Hits | Cache hits for image content |
| Image Hit Rate | Share of image requests served from cache |
| HTML Cache Hits | Cache hits for HTML content |
| HTML Hit Rate | Share of HTML requests served from cache |
| Bandwidth | Total traffic served |
| Threats Mitigated | Requests blocked by security |
Most cards show a percentage-change indicator against the previous period -- green for increases, red for decreases. The two hit-rate cards show the current rate only, without a change indicator.
Time Range
The time-range picker sits at the top of the dashboard and scopes every KPI, chart, and breakdown below it. Rather than fixed presets, it uses two anchors -- a start and an end -- each shown as an editable chip:
- Relative -- an offset from now, e.g. 1 hour ago or 7 days ago
- Absolute -- a specific date and time
- Now -- pins the anchor to the moment of each refresh
After editing an anchor, use the Update button to apply it (the button reads Refresh when nothing has changed) -- this reloads the data for the range. The dashboard does not auto-refresh; you refresh it when you want fresh numbers. The maximum window is 30 days, matching how long smoxy retains traffic data.
Traffic Chart
Traffic is shown in a single hero chart. A dropdown above the chart switches between six views:
| View | What It Shows |
|---|---|
| Requests | HTTP requests over time, stacked by status class (2xx, 3xx, 4xx, 5xx) |
| Image cache | Hit, Miss, and Bypass for image requests |
| HTML cache | Hit, Miss, and Bypass for HTML requests |
| Content type | Requests split by content type (HTML, JavaScript, image, CSS, font, other) |
| Blocked | Blocked requests, split by WAF, Rate Limit, and Bot Protection |
| Cache purges | Cache invalidation operations |
Chart Controls
- Hover a point to highlight its series and read the exact value at that time
- Drag across the chart to zoom into a narrower time range
The legend at the top right of the chart is a key only -- it is not clickable.
Breakdown Panels
Below the chart, four ranked lists break the selected window down by dimension:
| Panel | What It Ranks |
|---|---|
| Top hosts | The busiest hostnames on the zone |
| Status | The most common response status codes |
| Countries | Where requests originate |
| Top URIs | The most requested paths |
Clicking a Top hosts or Status row adds it as a filter on the requests below.
Recent Requests
The Recent requests table lists the most recent individual requests in the window -- time, status, method, host, URI, cache result, country, and response time. Use the search box (Search requests…) and Add filter above the table to drill into specific traffic.
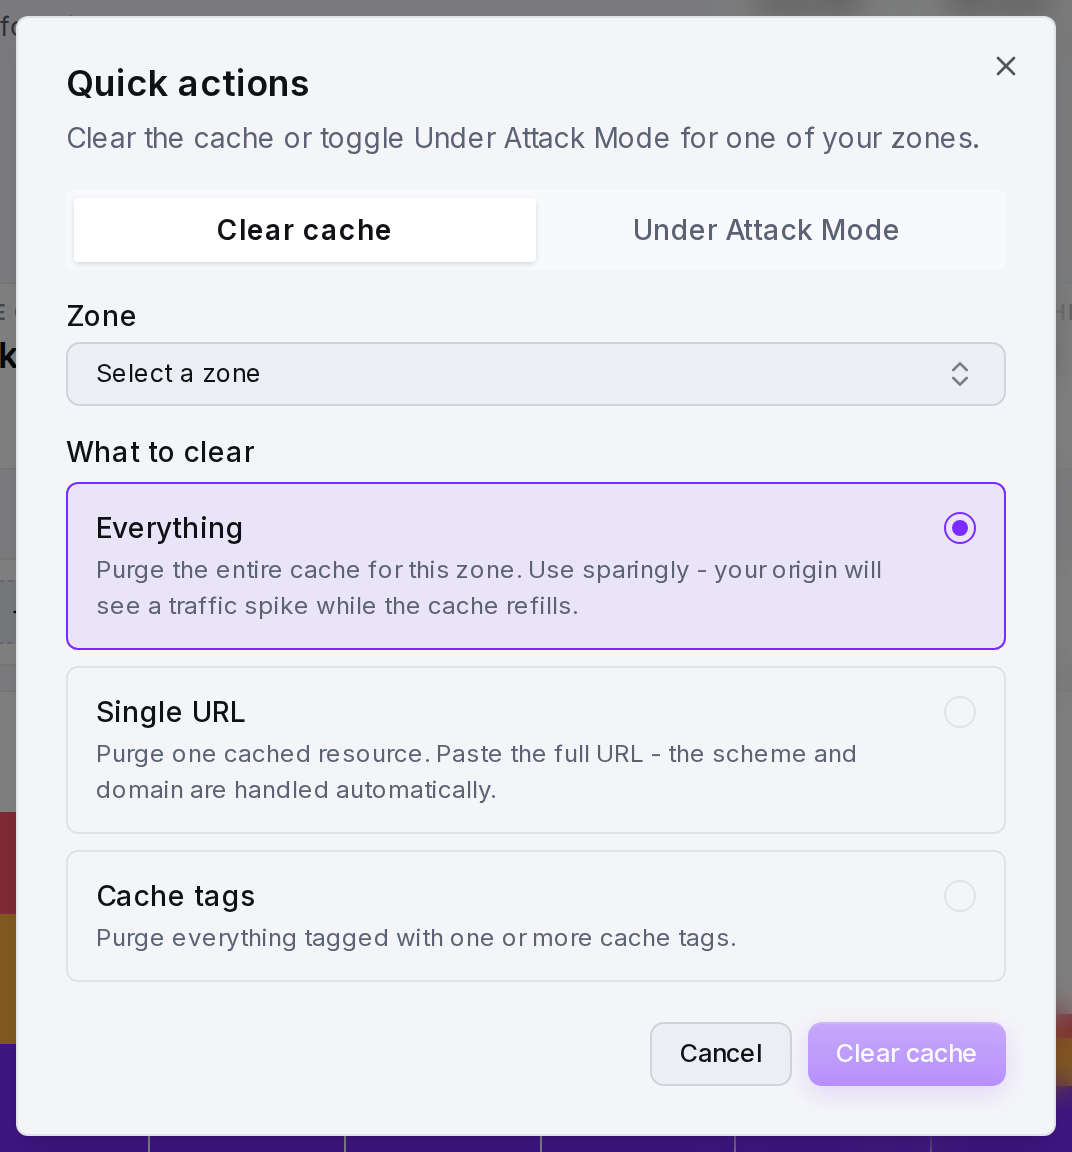
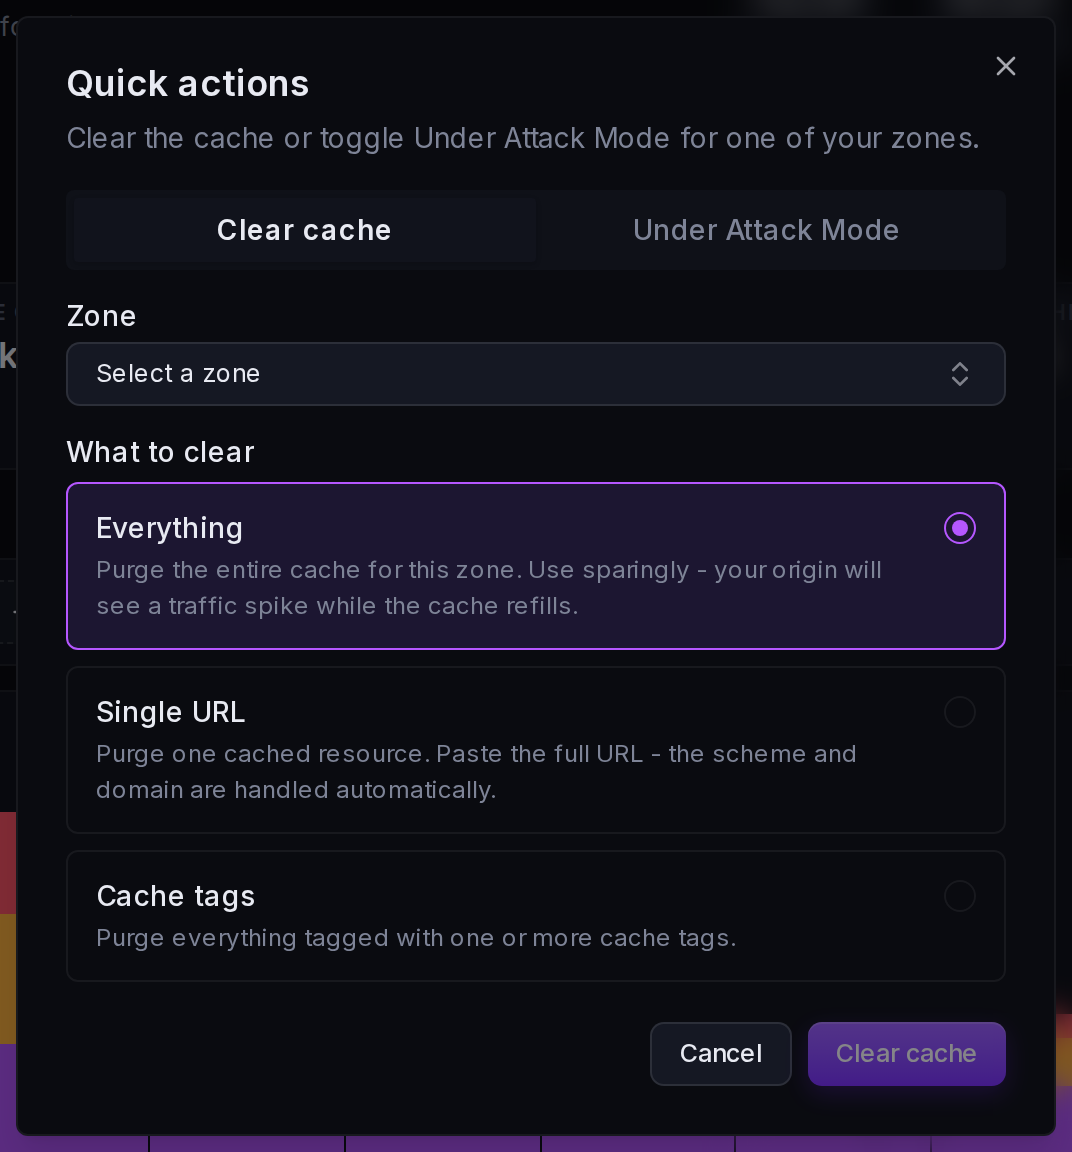
Quick Actions
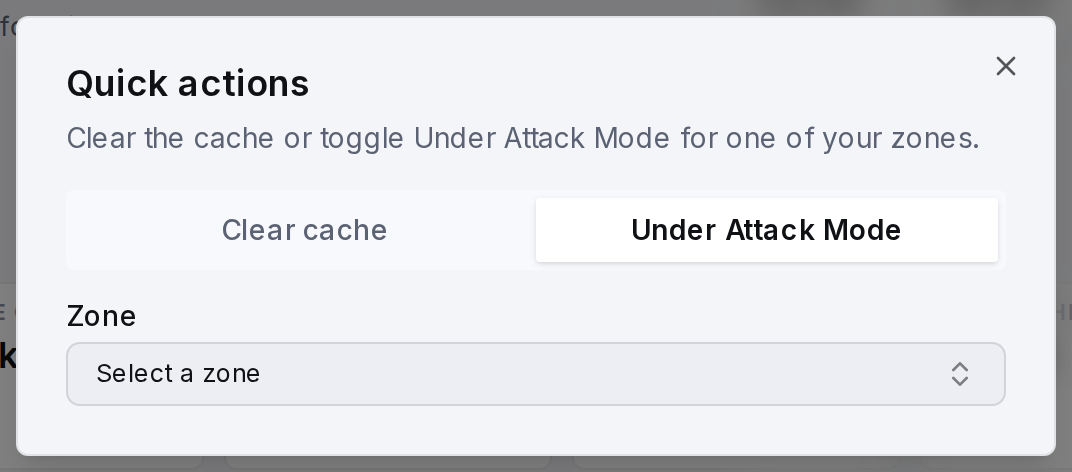
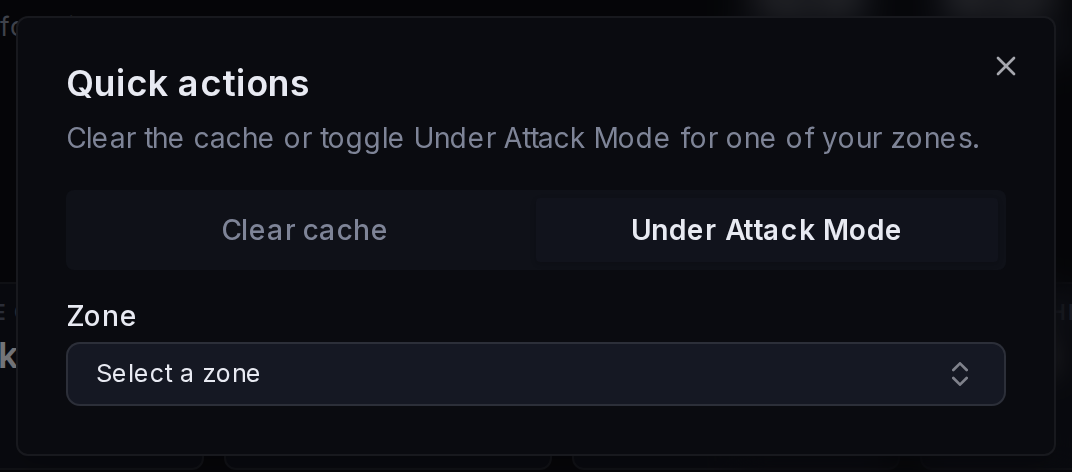
The Quick actions button (available across the dashboard) lets you act on any of your zones without leaving the page:
| Action | Description |
|---|---|
| Clear cache | Purge the entire cache, a single URL, or everything tagged with one or more cache tags |
| Under Attack Mode | Emergency DDoS protection that challenges all visitors before allowing access. See Security & WAF for details. |
Debug headers and other proxy-level helpers are configured on the zone's Proxy page.
Finish Setting Up Your Zone
While a zone still needs setup, every one of its pages shows a Finish setting up this zone checklist with four steps:
- Set the default backend -- choose the origin or load balancer traffic is sent to
- Assign a hostname -- attach at least one hostname to the zone
- Valid SSL certificate -- ensure the hostname has a valid certificate
- CNAME pointing at smoxy -- point the hostname's DNS CNAME record at smoxy
The checklist disappears once all four steps are complete. Turning the zone on or off is a separate control: use the Enabled / Disabled toggle in the zone header.